Some notes as we move through the final week of the season.
#Monday
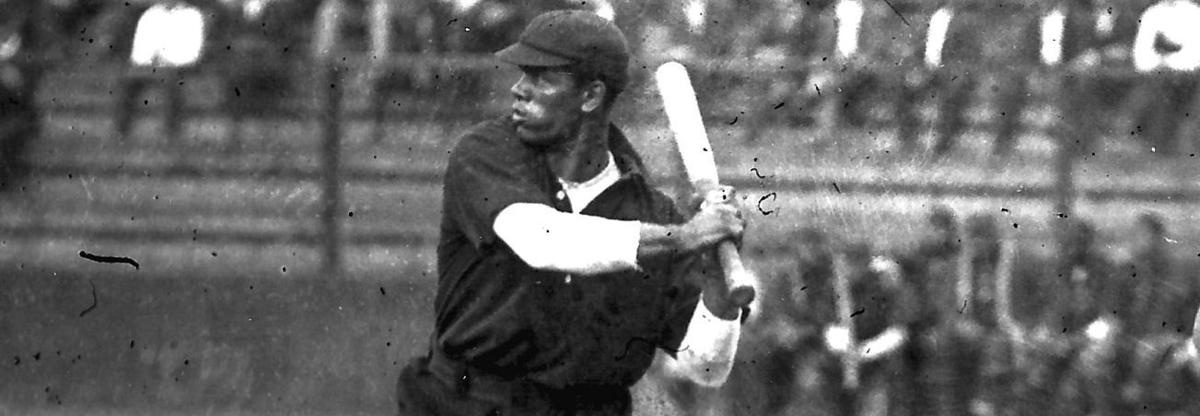
Miami moved in front of Detroit by a half game in the AL Wild Card race behind a great start from Phenomenal Smith, whose return may be a difference maker for the Cuban Giants. Smith gave up 1 run in 7 innings, moving to 4-0. Hal Newhouser was good for Detroit, but an early homer from Gary Sheffield and a late one from Joe Adcock sealed the game for Miami.
Miami Cuban Giants | 77-79 | — |
| Detroit Wolverines | 77-80 | 0.5 |
Cleveland was supposed to have an easy time of it, hosting the lowly Memphis Red Sox. But the Spiders’ bullpen collapsed, and they dropped a 9-8 decision to the visitors, who were powered by homers from Lefty O’Doul, Hack Wilson, and David Ortiz.
| New York Black Yankees | 89-67 | — |
| Cleveland Spiders | 87-69 | 2 |
In a series that means more for Indianapolis than Philadelphia, the ABC’s opened with a decisive win, 15-8 over the Stars. Johnny Bench hit 2 out, and the game wasn’t as close as the score (Philadelphia tallied 5 in the 9th to make it more respectable).
Houston Colt 45s | 81-75 | — |
| Indianapolis ABC’s | 78-79 | 3.5 |
| Kansas City Monarchs | 77-80 | 4.5 |
| Indianapolis ABC’s | 78-79 | — |
| Kansas City Monarchs | 77-80 | 1 |
| Wandering House of David | 76-81 | 2 |
#Tuesday
Detroit pulled back into a dead heat with Miami, pounding out 6 homeruns (2 from JD Martinez) in an 11-5 win. Ernie Lombardi, Tony Lazzeri, Oscar Gamble, and Ty Cobb also went deep for the Wolverines in an easy win for the visitors.
Detroit Wolverines | 78-80 | — |
| Miami Cuban Giants | 77-80 | 0.5 |
Memphis did it again, beating Cleveland 4-2, and dropping the Spiders 2.5 games behind the Black Yankees. Homers from Reggie Smith and Wade Boggs backed a strong showing from Stubby Overmire, who moved to 13-9 on the year. The Spiders, however, remained only 2 games behind the Black Yankees as New York fell to San Francisco, 9-0, as Bump Hadley improved to 18-6 with a masterful 1-hitter.
| New York Black Yankees | 89-68 | — |
| Cleveland Spiders | 87-70 | 2 |
Philadelphia stormed back from a 7-1 deficit, beating the ABC’s 8-7 on a pinch-hit walkoff shot from Aaron Judge–his 60th of the year–in a game that saw 2 grandslams, one from Indianapolis’ Ed Swartwood, the other from the Stars’ Charles Rogan. This was good news for Houston, who dropped a 9-8 decision to the New York Gothams, who were powered by 2 homeruns from Willie Mays. Houston remains 3.5 games ahead in the Marvin Miller Division.
Riding an excellent start from Rick Reuschel, the House of David pulled into a tie with Kansas City by defeating the Monarchs 3-1. Reuschel was supported by Ryne Sandberg‘s 40th homer of the year, and the win leaves both teams 1 game behind Indianapolis in the Wild Card race.
Houston Colt 45s | 81-75 | — |
| Indianapolis ABC’s | 78-79 | 3.5 |
| Kansas City Monarchs | 77-80 | 4.5 |
| Indianapolis ABC’s | 78-80 | — |
| Kansas City Monarchs | 77-81 | 1 |
| Wandering House of David | 77-81 | 1 |
#Wednesday
What you see depends on where you stand: Miami fans will be miserable at their bullpen’s performance, as the Cuban Giants’ relievers surrendered 11 runs over the final 4 innings n an 11-8 loss to Detroit. Wolverines fans, of course, will be applauding the clutch performance of their team, led by Juan Beníquez‘ 4 hits and 3 RBI’s from Charlie Gehringer and Bob Bailey. The win moves Detroit 1.5 games up in the Wild Card chase.
| Detroit Wolverines | 79-80 | — |
| Miami Cuban Giants | 77-81 | 1.5 |
The Spiders are struggling, but they refuse to give up: a Larry Doby homerun and walkoff RBI single from John Ellis gave Cleveland a 9-8 win over Memphis, keeping them at least within touch of the Black Yankees for the Bill James Division crown. Willie McCovey hit his 15th homerun in 35 games, and Paul O’Neill (the first of his WBL career) and Ron Blomberg also went deep.
The Black Yankees fell to San Francisco, as Eddie Plank earned his 20th win of the season with 6 strong innings for the Sea Lions. San Francisco’s bullpen–Ken Howell, Joe Nathan, and closer Rod Beck–fanned 7 of the 9 batters they retired, with Beck earning his 40th save of the season.
| New York Black Yankees | 89-69 | — |
| Cleveland Spiders | 88-70 | 1 |
Houston bounced back in a big way, using a phenomenal start from Ice Box Chamberlain and 7 homeruns to beat the Gothams, 9-2. Chamberlain allowed 1 hit in just under 8 innings, fanning 12 and 2 of the important cogs in the Colt 45’s late season surge–OF Gorman Thomas and C Will Smith–carried the team, twice launching back-to-back homeruns. Jim Wynn led off the game with a dinger, and Paul Goldschmidt and Jim O’Rourke also went deep.
The victory sealed the pennant for Houston, setting off raucous celebrations in the home dugout. It also meant all of the attention in the NL is now focused on the final Wild Card Spot, currently owned by Indianapolis, but with Kansas City and the House of David hot on their heels (and Homestead still hanging around with at least a mathematical chance).
After fighting back from a 6-1 deficit, Indianapolis suffered a gut-wrenching loss, falling to Philadelphia, 12-8. The Stars were led by homeruns from Sherm Lollar, Harmon Killebrew, Jung Ho Kang, and Sherry Magee.
Ryne Sandberg had 4 hits including a go-ahead solo homer in the bottom of the 8th as the House of David topped Kansas City, 6-5. Jack Taylor continued a late-season rebound with a solid start, but both bullpens struggled in this one. The victory moves the House of David into a dead heat with Indianapolis in the Wild Card chase, with Kansas City 1 game back.
| Indianapolis ABC’s | 78-81 | — |
| Wandering House of David | 78-81 | — |
| Kansas City Monarchs | 77-82 | 1 |
| Homestead Grays | 76-83 | 2 |
#Thursday
Miami just refuses to lose: Cleveland had taken the lead, 5-4 in the 6th inning, but the Cuban Giants scored 8 runs in their final 2 frames in a 12-6 victory. Miami pounded out 17 hits, led by 3 each from Jim Thome and Martín Dihigo. The game was never sure: Cuban Giants pitchers gave up 8 walks, so the Spiders had constant traffic on the basepaths. But they did just enough, with homeruns from Julio Rodríguez, Dihigo, Alejandro Oms, and Thome.
With the result, the Spiders drop to 1.5 games behind the Black Yankees and the Cuban Giants move to 1 game behind Detroit in the Wild Card race.
| Detroit Wolverines | 79-80 | — |
| Miami Cuban Giants | 78-81 | 1 |
Speaking of the Black Yankees … their bullpen continues to be their Achilles’ heel, with 4 relievers giving up 9 runs in 2.1 innings. Ouch. The big blows were homeruns from Jimmie Foxx and Bobby Bonds as San Francisco defeated New York, 13-10.
| New York Black Yankees | 89-70 | — |
| Cleveland Spiders | 88-71 | 1 |
#Friday
The Black Yankees continue not to grab the Bill James Division by the throat, falling to lowly Baltimore 5-4 in the opening game of the final series of the season. Homers from Eddie Murray, Manny Machado, and a final go-ahead blast from Earl Averill gave the Black Sox the edge in another game that saw less than stellar performances from New York’s bullpen.
Two homers from Gary Sheffield carried Miami to a 5-4 win over Cleveland, preserving New York’s 1 game advantage, and keeping the pressure on Detroit. The Cuban Giants got another strong outing from Jim Whitney, and were able to fade a 9th inning comeback from the Spiders for the victory.
So what will Detroit do with their opportunity?
Play a game for the ages where they held leads of 3-1, 4-2, 9-5, and 10-6. And it was never enough as, after closer Mike Henneman was forced from the game with a back injury, Troy Percival came in and gave up a grand slam to Manny Ramírez and a walkoff shot to Gabby Hartnett. Both Ramírez and Hartnett had 2 homers in the game, while Al Kaline had 2 for Detroit. Kaline had 3 hits and 7 RBIs while Hartnett had 4 hits for Memphis. A true thriller of a game that leaves everything pretty much undecided.
| New York Black Yankees | 89-71 | — |
| Cleveland Spiders | 88-72 | 1 |
| Detroit Wolverines | 79-81 | — |
| Miami Cuban Giants | 79-81 | — |
The House of David fell to Houston 8-2, as all eyes turned to the 4 game series between Indianapolis and Kansas City.
Kansas City’s Smokey Joe Wood and the ABC’s’ Luis Padrón squared off in the series opener and while each pitched well, neither were involved in the decision. Instead, after a 2 run shot from Ducky Medwick tied the game, Kansas City won it on a sacrifice fly from Dale Murphy in the bottom of the 9th. So Padrón fails in his attempt to win his 24th game of the year and, more importantly, Kansas City forces a 3 way dead heat for the final Wild Card spot.
| Indianapolis ABC’s | 78-82 | — |
| Wandering House of David | 78-82 | — |
| Kansas City Monarchs | 77-82 | — |
| Homestead Grays | 76-84 | 2 |
#Saturday
Memphis keeps embracing their role as spoiler while relying on a handful of late season call ups. In this case, Bucky Walters gave a good starting performance, Lefty O’Doul had 3 hits, and Wayne Causey drove in 2 with an 8th inning single for a 5-3 victory over Detroit.
It sure looks like Miami has found a key part of their rotation: Phenomenal Smith improved to 5-0, combining with Ricky Nolasco on a 3 hit shutout of Cleveland. Smith struck out 10 before yielding to Nolasco, for the last 2 outs. Martín Dihigo drove in 2 runs, continuing his second half surge.
Miami moves a full game ahead of Detroit for the Wild Card slot, and Cleveland falls 1.5 games behind the Black Yankees for the Bill James Division title, with New York’s magic number reduce to 1.
And then it was none. New York topped Baltimore 11-7 behind homers from Mickey Mantle, Babe Ruth, and Roger Maris, giving the Black Yankees their first Bill James Division title.
| Miami Cuban Giants | 80-81 | — |
| Detroit Wolverines | 79-82 | 1 |
Oh boy … Indianapolis has nobody to blame but themselves.
Behind a great start from Johnny Cueto and 3 RBI’s from Oscar Charleston, the ABC’s took a 6-2 lead into the bottom of the 9th, with their closer, Rob Dibble, on the mound. Dibble got one out, and then 16 of his next 20 pitches missed the strike zone, resulting in 4 consecutive walks, scoring a run. Rob Murphy relieved Dibble, and an RBI groundout and 2 wild pitches later, the game was tied at 6.
Cool Papa Bell walked in the bottom of the 10th, stole second, and scored on a hit from Ozzie Smith, moving Kansas City a game ahead in the Wild Card race.
#Sunday
The final day of the season leaves both final Wild Card spots up for grabs: in the AL, Miami has a 1 game lead over Detroit and in the NL, Kansas City has the edge over both Indianapolis and the House of David.
Miami was unable to clinch it: Larry Doby became the 2nd player in WBL history (and the first in the AL) to hit 4 homeruns in a game, driving in 7 as Cleveland topped the Cuban Giants, 13-7. That leaves Miami’s fate in the hands of Detroit later in the day.
Detroit used a mix of the old reliable–2 homeruns from Al Kaline and 1 from Ty Cobb–and the newly acquired (a strong start from Connie Johnson and key innings from Steve Howe and Troy Percival) to beat Memphis, 8-4.
And so, we finish in a dead heat.
| Miami Cuban Giants | 80-82 | — |
| Detroit Wolverines | 80-82 | — |
Eppa Rixey combined with 4 relievers (including an important 1.2 innings from Doc Mitchell), leading the ABC’s to a 7-3 win over Kansas City, meaning Indianapolis and the Monarchs finish with identical 79-83 records. The only question is if the House of David will join them in a 3-way tie for the final playoff spot.
Nope.
The House of David tried valiantly, and even outhit Houston, 10-8, but they fell to the Colt 45’s, 10-9 in a game that saw Tony Gwynn rap out 3 hits, reaching 200 on the season. Richie Hebner, Ryne Sandberg, and Anthony Rizzo each had 2 hits, but they didn’t get enough support as the House of David season ends, falling just short of the postseason.
#Monday
So, two playoff games, winner makes the postseason.
#AL
First up, we have Miami visiting Detroit.
The Cuban Giants will turn to Hugh McQuillan who, despite being roughed up in his last start, has been solid for Miami. If he struggles early, look for Jim Whitney to try to give the team some innings on short rest. For Detroit, Pete Conway will take the mound, also on a pretty short leash.
Ty Cobb may be almost universally disliked, but his baseball talent cannot be denied: he launched a 3 run homer in the top of the first and a grand slam in the 2nd, helping Detroit to a 9-0 lead after 2 innings.
Conway, meanwhile, had allowed a single run on 3 hits through 5, and left after 6 with the score 13-2.
Miami scored 3 in the 9th, but fell well short, 14-5. In the end, a just result, as Detroit really feels like the better team. Still, the Cuban Giants went from being the worst team in the league to being this close to the playoffs: a good year for them.
Cobb finished with 2 homers and 7 RBIs, and Al Kaline, Charlie Gehringer, Ernie Lombardi, and Hank Greenberg each also went deep. There was some bad news on Greenberg, who will be out of action for a few days with a leg injury.
#NL
Indianapolis would turn to Doc White while Kansas City gave the start to young Matt Morris.
Kansas City took an early lead on Albert Pujols‘ second homerun of the game, pulling ahead 6-3 after 3 innings, with the ABC’s runs coming on longballs from George Foster and Chris Sabo.
Morris was OK–not great, but not bad–until Tommy Helms singled and scored on a double from Barry Larkin in the top of the 4th. A Bob Bescher walk put runners on the corner, and fetched Frank Castillo from the bullpen. The move backfired as Sabo and Oscar Charleston singled and, after a couple of outs, Johnny Bench brought home 2 with a single of his own, giving Indianapolis an 8-7 lead. Foster followed with his 2nd dinger of the game, extending the lead to 10-7 and chasing Castillo. His successor, Bob Shawkey, gave upa solo shot to Helms and when all of the dust settled, the ABC’s had scored 8 and were up 11-7.
The ABC’s coasted from there, riding additional homeruns by Ed Charles and Sabo to a 15-8 win, powering Indianapolis into the postseason. Sabo drove in 5 and Foster 4, with each of them notching 3 hits on the day.
Kansas City had ridden its pitching staff all year; here their arms betrayed them, surrendering 14 hits and 15 runs.